Meta has announced the launch of Meta AI in South Africa with built-in Llama 3 on WhatsApp. This is a leapfrog step for…
In graphs: Cape Town’s dam storage jumps by 28% in just 8 weeks

At the end of April, the water situation in Cape Town was dire. Dams were nearly empty. In fact, the Department of Water and Sanitation was building a coffer dam — a smaller dam — within the Theewaterskloof to extract the last 10% of its water.
This week, in the middle of June, the numbers are telling a much different story. Dam levels are now at 38.1%, an increase of more than 27% over its lowest levels recorded on 23 April, and a 6.3% increase over last week. That’s an additional 56.5-billion litres of water added to Cape Town’s surface storage since last week’s report.
Judging by the City’s drawdown tracker, we’re now collecting more water per week than the consumption rate.

The two largest dams however remain fairly low, albeit much healthier.
The aforementioned Theewaterskloof Dam is now 27.2% full, up from 21.3% last week and 10.9% back in April. It’s now nearly as full as it was back in June 2016, but still languishes behind June 2014’s high water mark of 96.5%.
Cape Town’s second largest dam, the Voëlvlei, is currently 30.3% full, up from 24.8% last week, and 13.8% at its lowest point in April. It currently holds more water than it did in June 2016. In June 2014, it was 79.3% full.
The City’s Berg River Dam jumped by 8.3% over last week, with stores currently tipping the 62.6% mark. That’s the dam’s highest June figure since 2014.
The nearby Wemmershoek Dam is also up from 58.2% last week to 66.9% this, and is slightly less than 20% emptier than it was in June 2014, the year just prior to the drought.
Finally, the Steenbras Lower and Upper Dams are also up this week. The former sees an increase of 4.1% over the previous week, while the Upper Dam is 82.5% full, up from 77% last week.
Thanks to these numbers, the City of Cape Town’s graph suggests June 2018 has been among the wettest in the city since 2013. And even before mid-winter, Cape Town already has more water stored in its dams right now than at the beginning of summer in 2017.

The reason for the sudden spike in dam levels can’t be attributed to reduced consumption. Cape Town’s residents are still using some 80-million litres per day more than the City’s goal. 520-million litres per day were used throughout last week, with 487-million sourced from the aforementioned dams.
The rainfall over the past few weeks has made the real impact.
According to the City of Cape Town’s data, the Wemmershoek catchment has already received more than its long-term average for June; 183.5mm has fallen in this area since 1 June.
The Theewaterskloof Dam catchment area has seen 63.9mm this month, only slightly less than its long-term month average.
As for the Voëlvlei Dam, it has received 25mm more than its month average, with 133mm recorded in the area since June began.
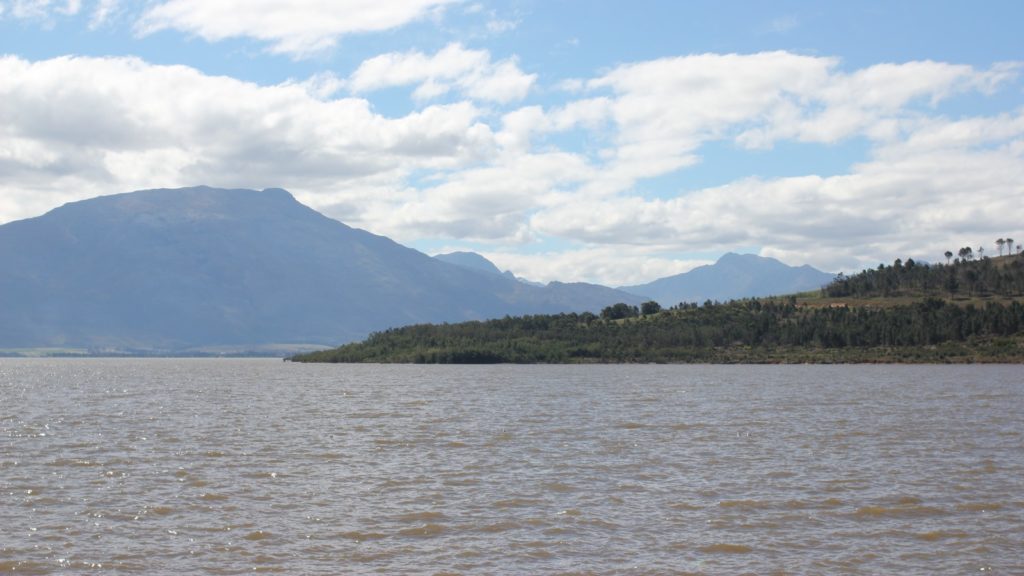
Feature image: Theewaterskloof Dam in 2014 by SA-Venues.com via Flickr (CC 2.0 BY)