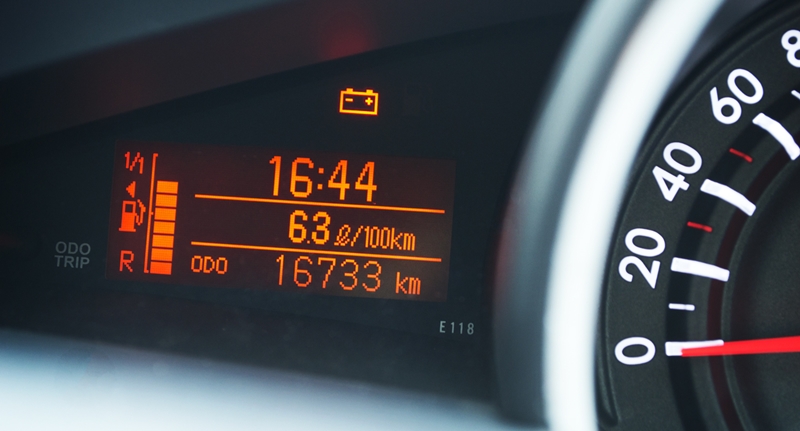
So, youâ€
You eventually settle on a neat compact hatchback, swayed by the little sticker on the window declaring that it consumes a mere 4.3 litres per 100km. After a spot of messy mental arithmetic, you deduce that youâ€
No ad to show here.
“I may even forget where the filling station is,†you chuckle to yourself, thinking of all the exciting things youâ€
Then, reality sets in…
Yet, a few months later — after a futile attempt to convince yourself that the new engine simply needs a spot more “bedding in†— you realise that youâ€
At this point, you turn your high-octane ire towards the lying money-grabber of a manufacturer that flogged you the vehicle in the first place. Thing is, you shouldnâ€
You see, the typical car-maker doesnâ€
No, if your anger absolutely has to be aimed somewhere, let it be in the direction of the very tests applied to determine these official economy figures. Although even that wouldnâ€
Controlling the variables
Why not? Well, not one of the major recognised driving cycle tests currently professes to produce a “real-world†figure — even though many were originally designed to simulate true conditions – and not one can be expected to, seeing as everyoneâ€
Interestingly, in the US, the Environmental Protection Agency — through which all official economy figures must pass — independently tests just 15 percent of all nameplates sold annually, largely relying on manufacturers to submit their own results. Admittedly, this has seen a number of car companies — including Ford, Honda, Kia, Hyundai and General Motors — face class action lawsuits over the use of inaccurate figures. Some of this was down to misleading wording used in their advertising (hence the proliferation of asterisks in subsequence commercials), but certain manufacturers also admitted making what they termed “procedural errorsâ€. Itâ€
So why are the certified figures — even those ratified by independent bodies — so much lower than what you and I are likely to achieve out on the road? Well, first and foremost, the tests are conducted in a controlled environment (an automotive laboratory, if you will), while your daily route to work is subjected to countless external – and consequently highly variable — factors. The road surface, altitude, weather conditions, engine wear, quality of fuel and even your tyres are just a handful of dynamics that dictate how far you can travel on a tank of fuel. Then, of course, thereâ€
How are the tests performed?
The New European Driving Cycle (NEDC) — which provides figures for numerous markets around the globe, but ironically is anything but new — is performed on a dynamometer (or “rolling roadâ€) at a set temperature with a set load, and with all power-sapping ancillaries (think air-con, headlights, heated seats, etc.) switched off. An urban driving cycle is carried out, entailing timed acceleration, deceleration and idling over a theoretical distance of 4 067 metres. The entire four-part cycle takes 13 minutes, at an average speed as low as 18.77km/h.
An extra-urban driving cycle taking nearly seven minutes and covering 6 956 metres at an average speed of 62.6km/h is then thrown into the mix, before a combined cycle figure -– the one youâ€
Although stringent, these outdated assessments themselves encourage manufacturers to fine-tune their vehicles for maximum efficiency under testing conditions rather than for everyday driving. In fact, emission performance can quite easily be optimised for the testâ€
Such loopholes exist, and one cannot genuinely expect manufacturers not to exploit them. In fact, itâ€
Change is afoot…
But, if this still doesnâ€
But, in the meantime, hereâ€
Itâ€
