

The City of Cape Town’s latest dam report looks a lot different, adding some new info going into the city’s final summer months.
Published on Monday, the report now includes a breakdown of water produced from various sources, including the primary dams, minor dams, ground water and springs, and desalination plants.
No ad to show here.
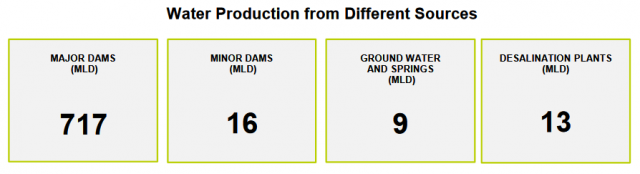

Image: City of CT
That breakdown, as of 24 February, was 717, 16, 9, and 13-million litres per day, respectively.
Overall, Cape Town consumed 755-million litres per day in total last week.
Along with the warmer weather, this dropped major dam levels to 65.9% — still more than 10% higher than February 2019’s levels, but markedly lower than years prior to 2015.
The City of Cape Town has also included a breakdown of minor dam levels and usage, affecting smaller suburbs around Cape Town.
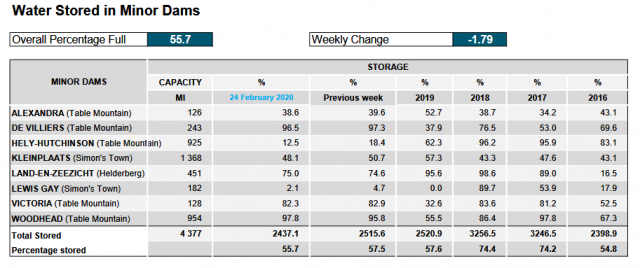

Image: City of CT
At present, minor dam levels stand at 55.7%, dropping 1.8% over the previous week.
Finally, it’s improved its rainfall reporting by adding a monthly accumulation graph for Wemmershoek Dam. It’s a great addition for understanding how wet the forthcoming winter could be.
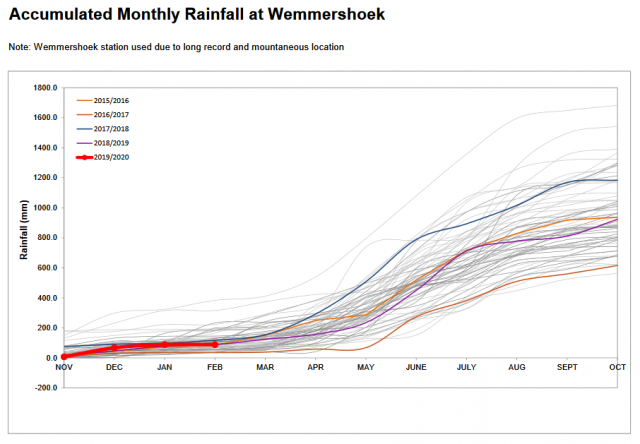

Image: City of CT
Read the new weekly dam report here.
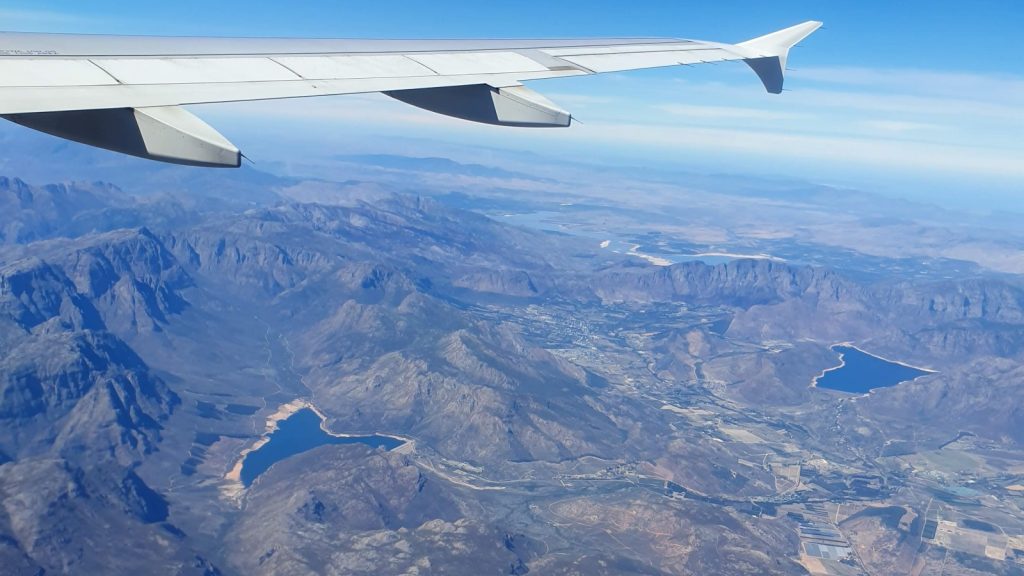
Feature image: the Wemmershoek Dam (foreground), with the Berg River (middle right) and Theewaterskloof Dam (background) from the air, by Andy Walker/Memeburn