Elon Musk’s AI chatbot Grok has once again found itself at the centre of controversy after the most recent update to Grok 3 triggered…
Graph: Cape Town’s dams are in much better shape than last year

Cape Town’s combined dam level have dropped another 0.7% over the previous week, the latest report from the City revealed.
Issued on Monday, the report also suggests that dam levels currently stand at 73.4%, a little over 2% lower than 2018’s high water mark.
It’s a far cry from where we were in November 2017 though, when dams were just 37% full. A year before that they stood at 58%.
Cape Town dam levels as of 12 November 2018
So, how are individual dams doing?
- Theewaterskloof Dam: was 57.1%, down by 0.3%, now 57.1%
- Voelvlei Dam:was 95.5%, down by 1.6%, now 93.9%
- Berg River Dam: was 99.3%, down by 0.8%, now 98.5%
- Wemmershoek Dam: was 91.2%, down by 1.2%, now 90%
- Steenbras Lower Dam: was 71.2%, down by 2.2%, now 69%
- Steenbras Upper Dam: was 85.1%, down by 0.8%, now 84.3%
Overall, the dams lost around 6.6-billion litres over the previous week.
Consumption remained slightly below the 550-million litres per day mark, with 48% of that total used for agriculture, and 52% used within the City of Cape Town and other urban areas.
Expect dams to continue the drying trend through the month too. November isn’t known for being a wet month for Cape Town.
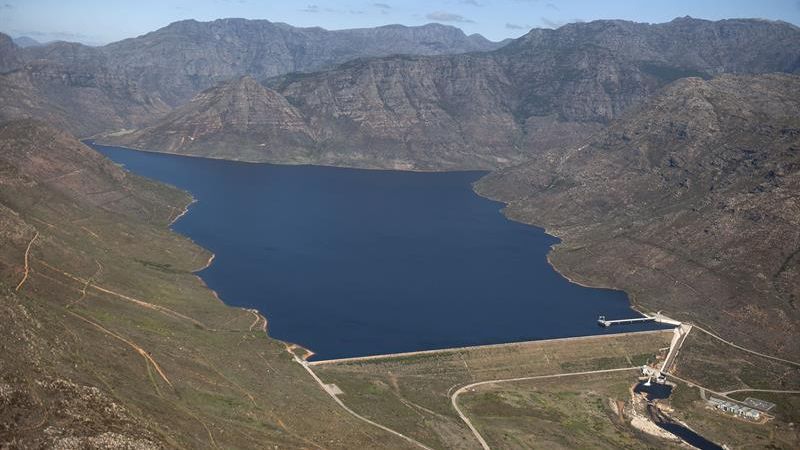
Feature image: Berg River Dam, September 2018 by City of Cape Town