Elon Musk’s AI chatbot Grok has once again found itself at the centre of controversy after the most recent update to Grok 3 triggered…
Lockdown: Google report shows big uptick in movement in SA


The latest Google Community Mobility report has shown a significant uptick in movement in South Africa following the introduction of level 3 lockdown regulations.
This report is an ongoing project by Google that uses anonymised data to see trends in community movement during the COVID-19 pandemic.
The latest report, from 7 June, shows that South Africans are indeed visiting retail centres, supermarkets, parks, and workplaces more since the introduction of level 3. However, we’re still moving around less when compared to pre-pandemic levels.
So what does the data say?
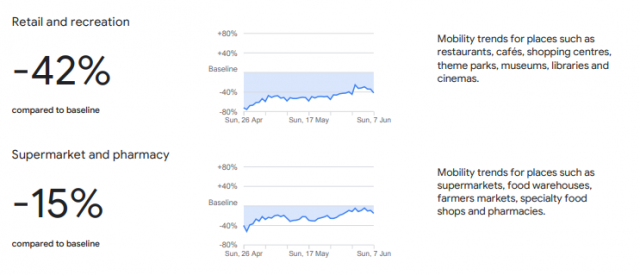
When it comes to retail locations and supermarkets, movement has reduced by 42% and 15% respectively when compared to pre-pandemic levels (February 2020). However, compared to April, this is actually an increase of 37% and 45%.
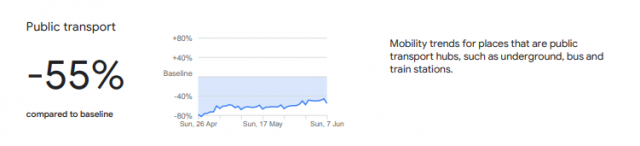
Residents are still using public transport far less than pre-pandemic levels, with a 55% reduction in movement. However, compared to April, there has been a 25% increase in the use of public transport since level 3 was introduced.
Meanwhile, workplaces show the biggest difference in activity since lockdown level 3 started.

The report shows that workplaces are almost back to pre-pandemic levels, with only a 6% reduction in movement. Compared to April, when level 5 was in place, this is a 43% increase in movement.
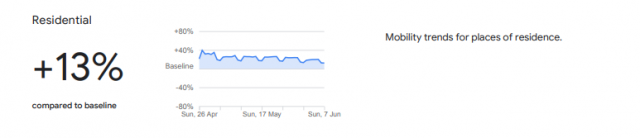
More people are still staying at home when compared to pre-pandemic levels too. The mobility at residential locations shows a 13% increase since pre-pandemic levels. But this is an 11% decrease since lockdown level 5.
Lockdown movement: Provinces compared
Google’s report also now provides a regional overview of movement for each province.
The stats show that people in Gauteng are staying home more than any other province. The province has a 15% increase in residential movement compared to February.
When it comes to workplaces, there is a stark contrast between provinces. Some provinces, such as Limpopo and Mpumalanga, actually show an increase in workplace movement when compared to pre-pandemic levels.
So what’s happening in South Africa’s coronavirus hotspot, the Western Cape?
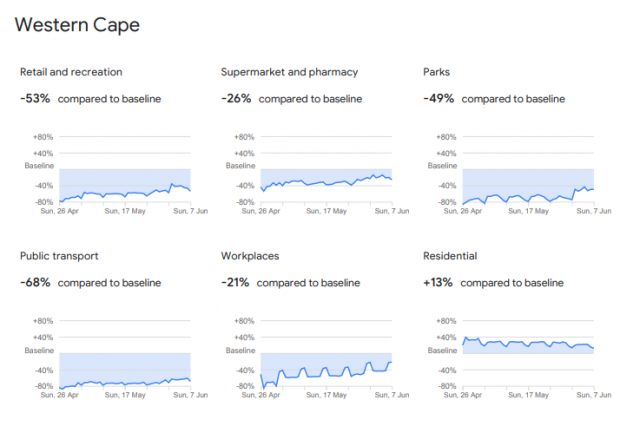
The province has the lowest workplace movement levels, showing a 21% decrease since pre-pandemic levels. The Western Cape also has the largest decrease in movement in parks, supermarkets, and retail locations than any other province.
While the data can’t account for every person, it does give a broader picture of movement than many other datasets.
Google hopes that this data can give authorities insights into movement, helping them make more informed decisions about policy.
You can download the full report on the Google Community Mobility Report website.
Feature image: Tai’s Captures on Unsplash