LG’s 100-Inch QNED evo AI TV Redefines Big-Screen Viewing in South Africa In a bold leap forward for home entertainment, LG Electronics South Africa…
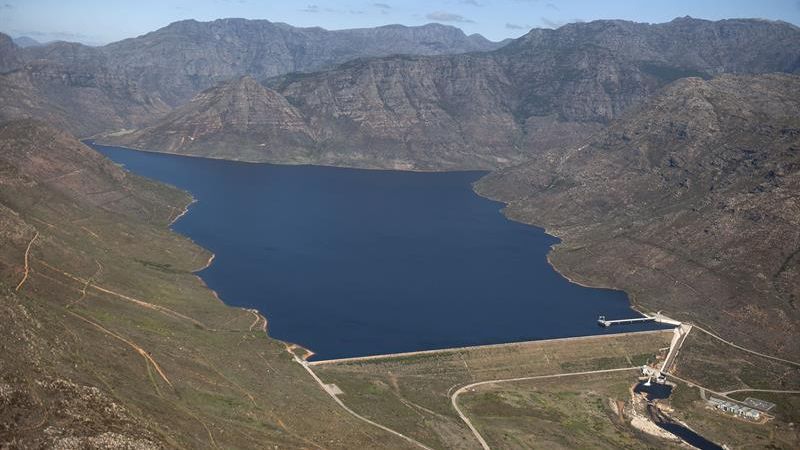
Cape Town’s December dam levels decline, but there are positives

As of 10 December 2018, Cape Town’s dams are 69.5% full, declining by 0.9% over the previous week.
This may seem like a substantial loss, but digging a bit deeper into the City of Cape Town’s latest dam report (pdf), you’ll find that it’s not all doom and gloom.
As Level 3 water restrictions are in place — since the beginning of December — the overall daily water consumption of the city remains below 550-million litres per day. The City’s current consumption target for agriculture and urban use is 650-million.
The knock-on effect is positive. According to the City’s dam storage vs. potential system risk graph (below), the dam storage capacity at present is above the the projection.

Yes, this means Cape Town is consuming water at a slower rate than planned.
This positive situation is aided somewhat by the December weather. It’s been a much wetter end of year than average for a number of areas across the City, including Newlands, Wynberg, and the Voelvlei catchment area.
The Wemmershoek Dam too is less than 3mm shy of hitting its monthly long-term average.
Overall, all dams bar one have seen a storage level decline this December, but it’s not extraordinary for the summer period.
- Theewaterskloof Dam dropped 1.1% to 53.7%.
- Voëlvlei Dam dropped 1.8% to 89.1%.
- Berg River Dam dropped 0.4% to 94.1%.
- Wemmershoek Dam dropped 1.5% to 83.4%.
- Steenbras Lower Dam dropped 2% to 75.2%.
- Steenbras Upper Dam gained 6.9% to 72%.
In total, the dams hold 624-billion litres at present, down from 631.7-billion last week.
It’s a lot more than what we had in 2017, when just 308-billion litres — just over a third of the city’s dams’ total storage — were held.
All images: City of Cape Town