Sony launches the WF-1000XM6 in South Africa with upgraded noise cancelling, better call clarity and premium sound. Pricing starts at R7,999.
Is there a way to predict loadshedding?

With announcements around loadshedding and its stages often catching residents by surprise, is there any way to predict when rolling blackouts are likely to occur in South Africa?
Apps that track loadshedding rely on notices and announcements from Eskom.
But besides these announcements and reporting by the media, are there other ways to see the outlook and likelihood for loadshedding?
How to keep track of loadshedding risk
Eskom lists a number of ways to stay informed regarding the risk of loadshedding.
Some of these will be familiar to residents: looking out for notices on Eskom’s social media channels and notices on the Eskom website.
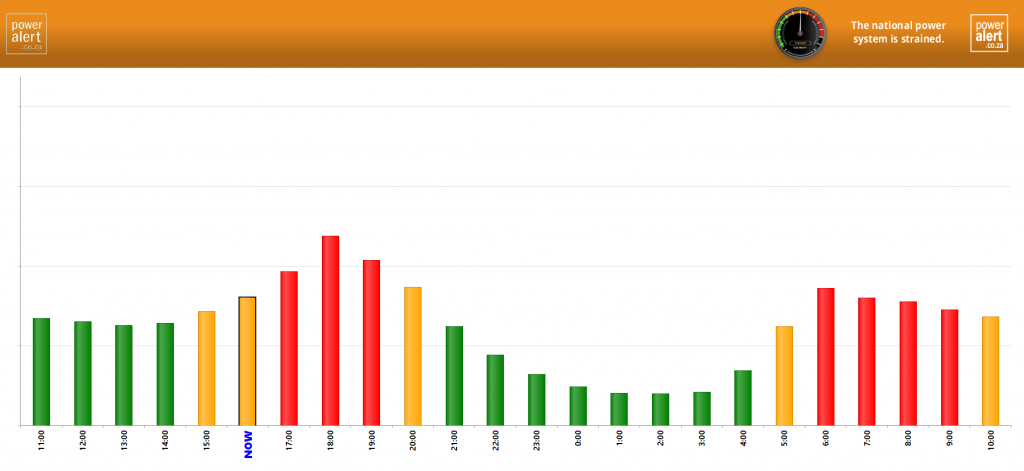
There is also a website where you can keep track of demand on the system and the current risk level. You can find this information on PowerAlert.co.za. However, sometimes the system status is a bit delayed.

This is the easiest way to monitor the grid.
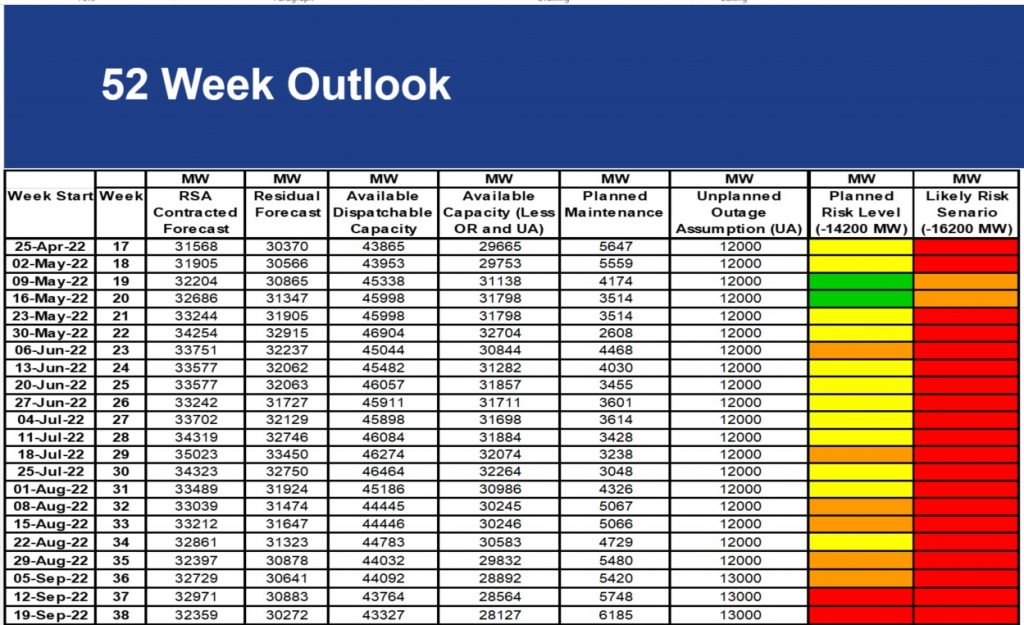
But there are also other methods for forecasting loadshedding: such as checking Eskom’s weekly system status reports.
These reports include summaries of outages and energy availability over the past few weeks.
They also include three-month outlooks from Eskom that have a forecast of demand versus available generating capacity.
“Colour codes ranging from Green (no shortage) to Red (worst case) are used to indicate the absence or presence of a capacity constraint,” Eskom notes.

Over time, this forecast changes according to a number of factors. For example, the forecast in Week 16 of 2022 shows a much greater risk when compared to Week 1.
These reports also show planned maintenance. When maintenance and breakdowns reduce supply, the risk for loadshedding increases.
If you want more data and to take a closer look at supply and demand for the national grid, you can visit Eskom’s data portal.
This site includes a range of graphs and trackers you can use. However, it can be difficult for ordinary consumers to wade through the data.
Read more: With electricity hike on the way, WhatsApp scam promises discount prepaid tokens
Feature image: Andrey Metelev/Unsplash


